
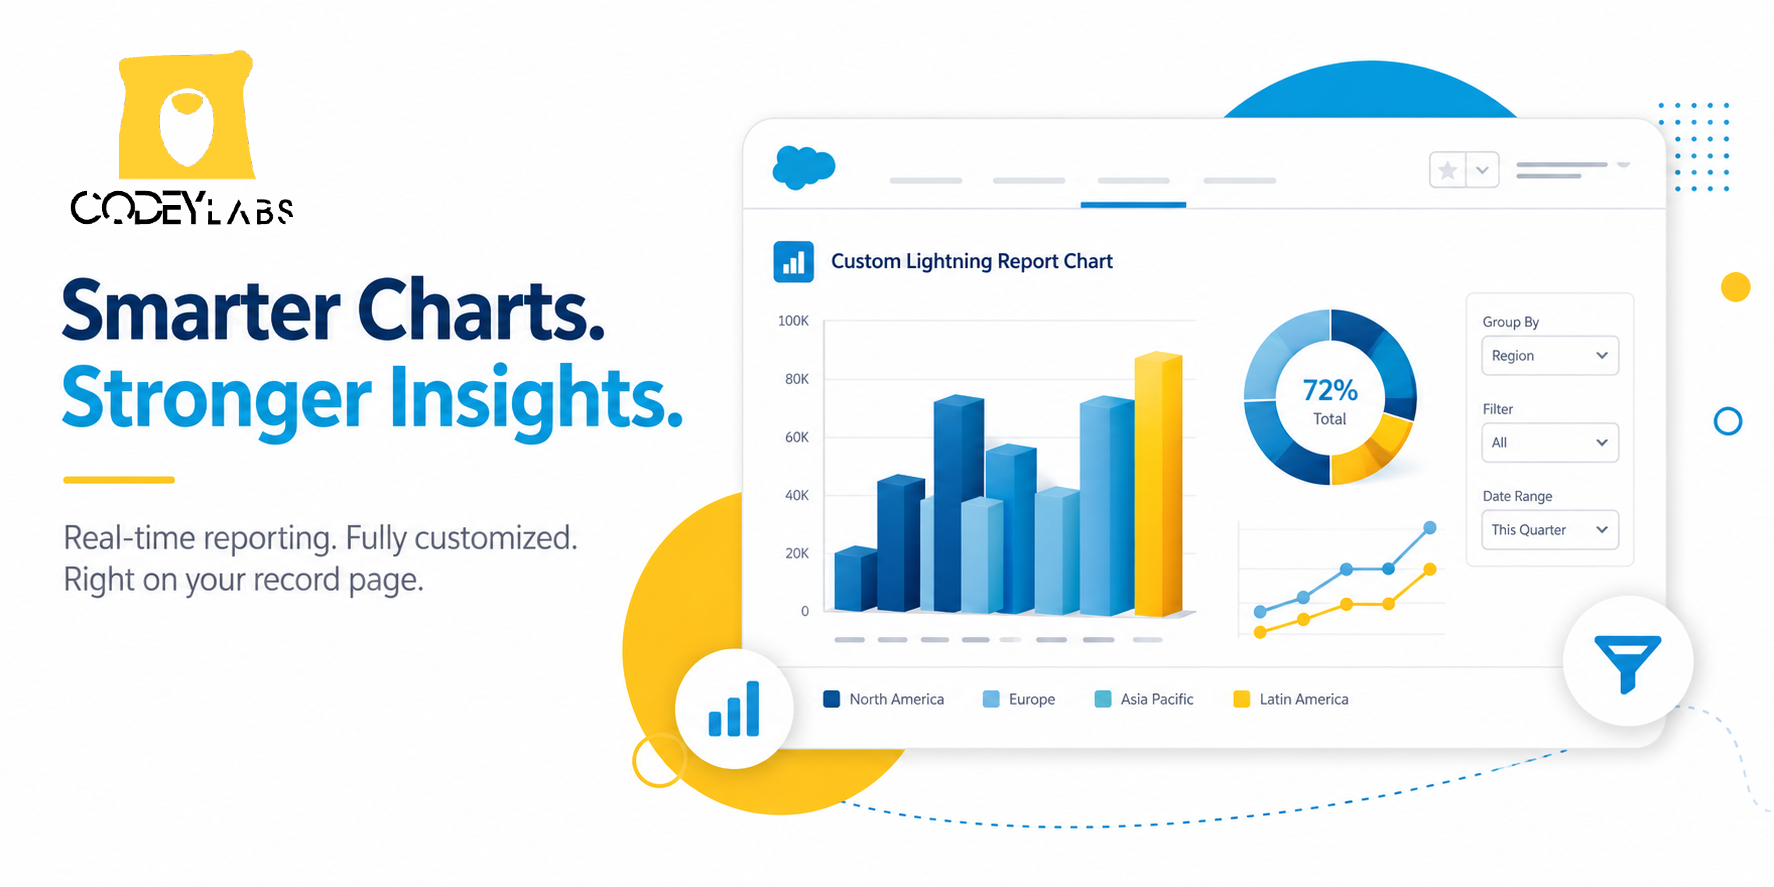
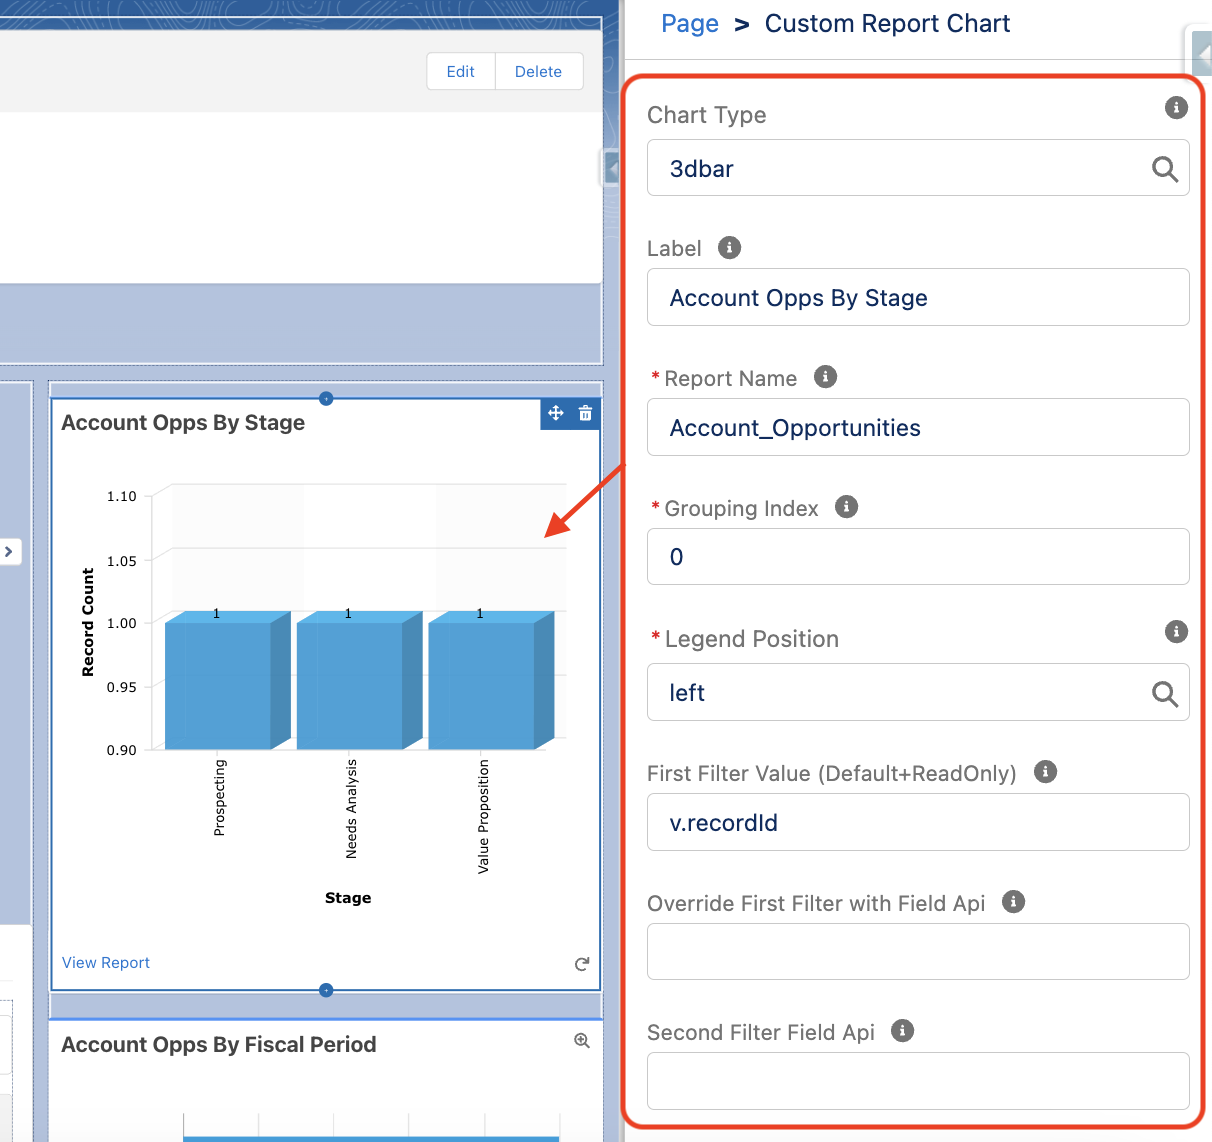
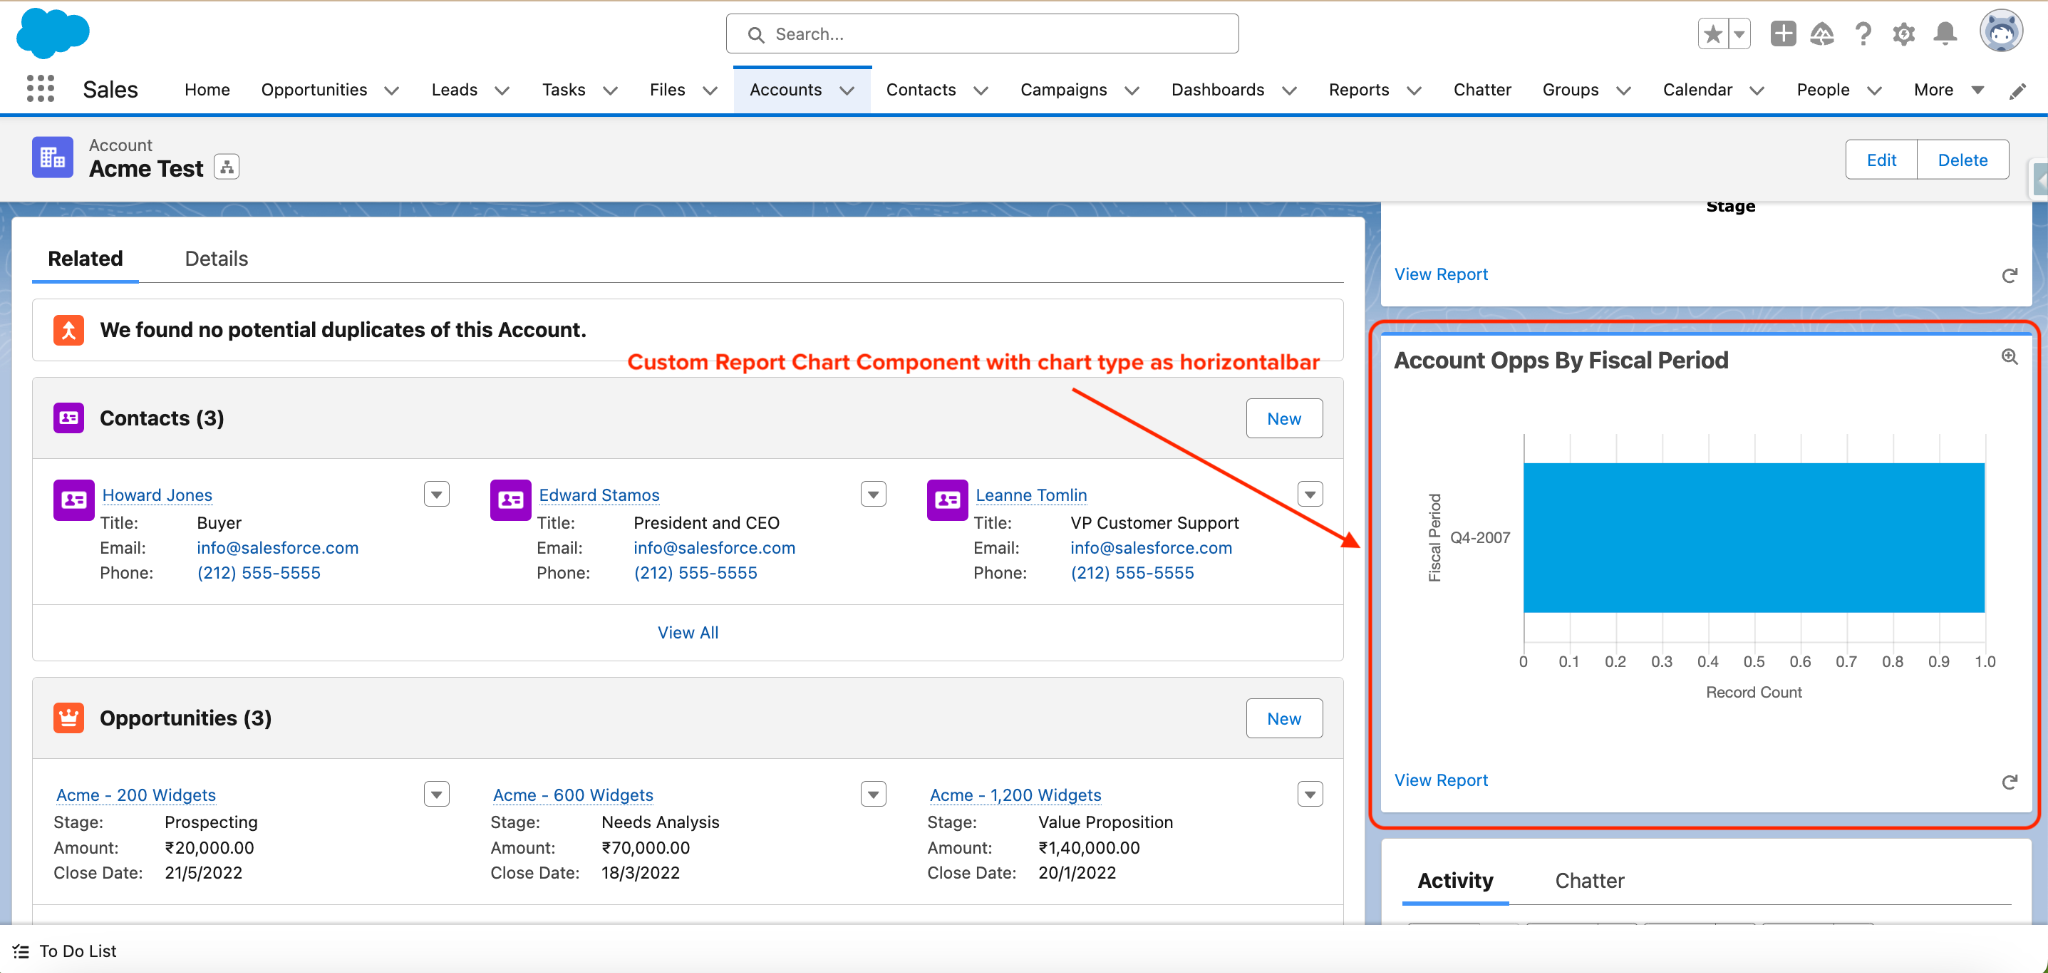
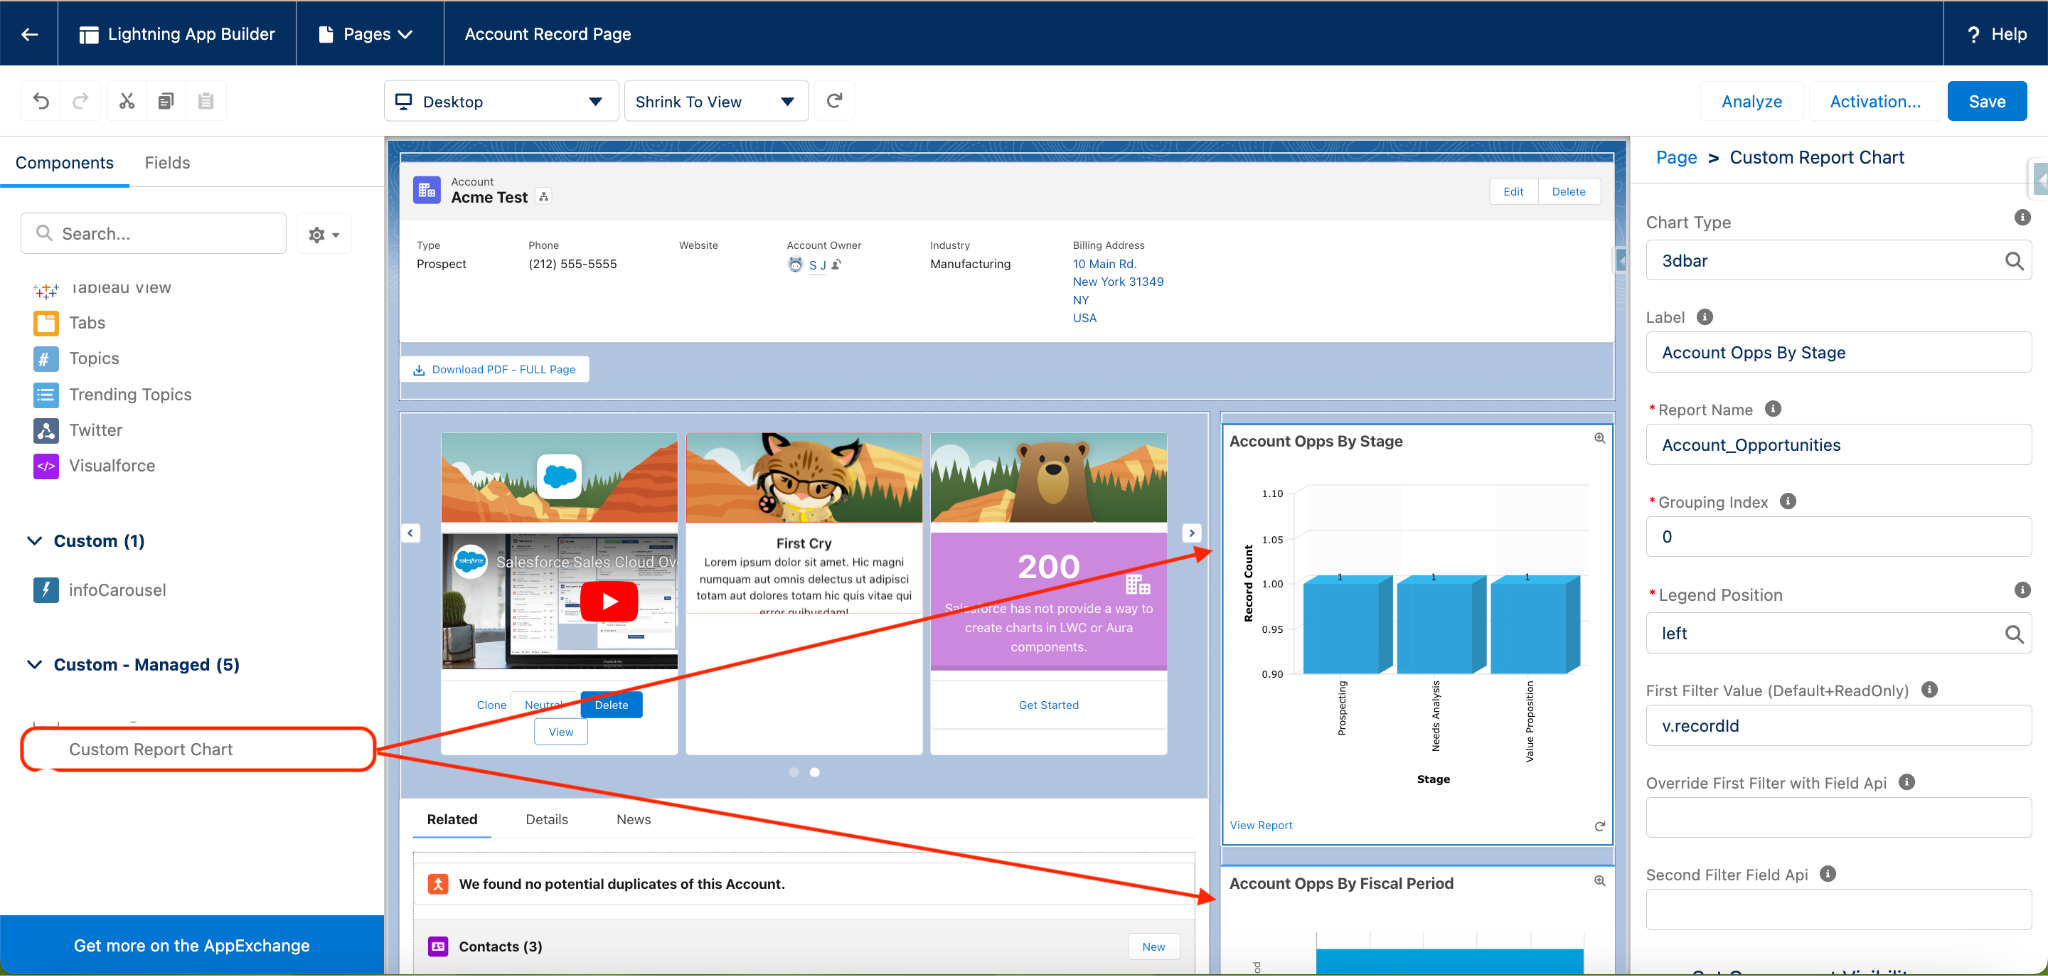
Custom Lightning Report Chart
Get flexible, real-time reporting with a wide range of chart types and customization options.
When Salesforce's native point-and-click report chart features fall short of addressing your simple needs, test our Custom Lightning Report Chart. Designed for seamless integration and intuitive usability, it offers dynamic updates and a variety of chart types. Clear labeling and smart filtering ensure data comprehension and actionable insights.
Accessible directly from any record page, it supports either first or second-level grouping in report, empowering users with relevant data insights. Whether monitoring sales performance or analyzing campaign effectiveness, our Custom Lightning Report Chart delivers clear, actionable insights in real-time or upon refreshing the page layout.
Key Highlights
Enhanced Flexibility
Our Custom Lightning Report Chart offers a wider range of chart types, including advanced options like 3D bar charts, providing users with more flexibility to visualize their data in the most effective way possible.
Integrate with Record Pages
Unlike Salesforce's native report charts, our solution is seamlessly integrated into record pages, eliminating the need for users to navigate away from their current workflow to access insightful data visualizations.
Real-Time Updates
With dynamic updates and interactive features, such as smart filtering and group index visualization, users can gain real-time insights. enhancing their decision-making process.
Customization and Accessibility
Our Custom Lightning Report Chart offers extensive customization options, from labeling and legend positioning to permission controls, ensuring that users can tailor their data visualizations to suit their specific needs.
Watch Our Demos